ENVIRONMENT AND ENERGY
Convection Permitting Latitude-Belt Simulation Using the Weather Research and Forecasting (WRF) Model
Principal Investigator:
Volker Wulfmeyer
Affiliation:
Institute of Physics and Meteorology, University of Hohenheim
Local Project ID:
XXL_WRF
HPC Platform used:
Hornet of HLRS
Date published:
Thanks to the availability of HLRS’s petascale HPC system Hornet, researchers of the Institute of Physics and Meteorology of the University of Hohenheim were able to run a highly complex climate simulation for a time period long enough to cover various extreme weather events on the Northern hemisphere at a previously unmatched spatial resolution. Deploying the highly scalable Weather Research and Forecasting (WRF) model on 84,000 compute cores of Hornet, the achieved results confirm an extraordinary quality with respect to the simulation of fine scale meteorological processes and extreme events.
Key Facts:
• 84,000 compute cores
• 84 machine hours
• 330 TB of data
• 12,000*1,500 horizontal grid points (resolution 0,03°) with 57 vertical layers
• 535,680 time steps
Persistent so-called omega and blocking Vb weather situations in Europe are responsible for extreme events like the heat waves in summer 2003 in Central Europe and in August 2010 in Russia (which was associated with flooding of the Odra and in Pakistan) as well as severe flooding events like in summer 2002 in Germany. Omega and blocking Vb weather situations are caused when quasi-stationary, quasi-resonant enhanced and quasi-resonant Rossby waves develop in mid-latitudes. In numerical weather prediction and climate models, at least a resolution of 20 km is required to simulate quasi-stationary Rossby waves, however, to simulate the associated extremes the simulations need to be convection permitting. Further, the high resolution allows the small scale structures to feed back to the large scale systems, especially over mountain ranges and over the ocean.
Most of the current limited area, high-resolution models apply a domain which is centered over the region of interest and has 2 longitudinal and 2 latitudinal boundaries. Such limited area model applications may suffer from a deterioration of synoptic features like low pressure systems due to effects in the boundary relaxation zone when downscaling reanalyses or global climate model simulation data. For Europe this is mainly caused by the longitudinal boundaries which are located over the North Atlantic at around 20°W and Eastern Europe close to 20°E. Especially the boundary over the North Atlantic can destroy low pressure system features which are responsible for the weather and climate development over Europe. A possibility to overcome this is to run a latitude belt simulation. Here only boundary conditions at the northern and southern boundaries of the model domain are required.
The Weather Research and Forecasting (WRF) model was applied at 0.03° horizontal resolution for July and August 2013 forcing the model 6-hourly with ECMWF analyses at 20N and 65N. Sea surface and inland lake temperature was updated daily with data from the OSTIA project of the UK Met Office, which is available at 5km resolution.

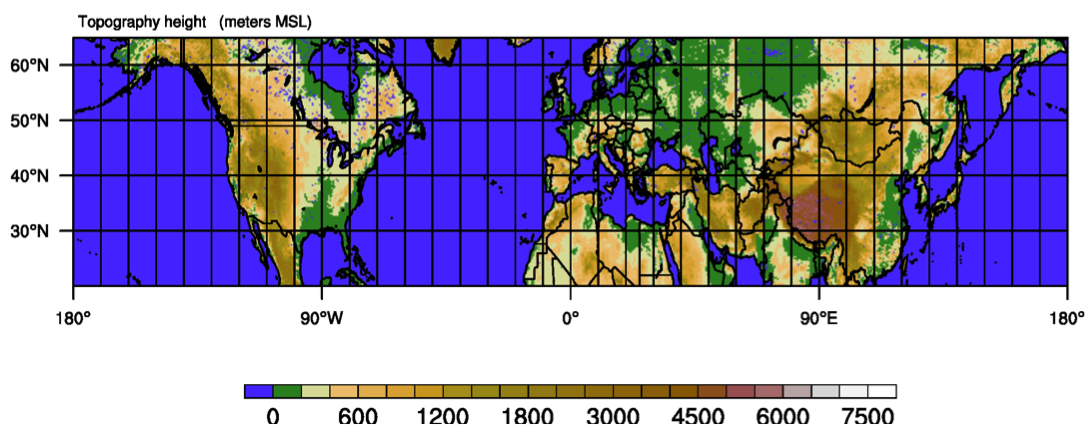
Figure 1: Convection permitting model domain with topography as shaded areas. The southern and northern boundaries are at 20°N and 65°N, respectively.
Copyright: University of HohenheimFigure 1 shows the domain with the model topography as shaded areas. The model domain consists of 12000*1500 boxes with a horizontal resolution of 0.03°. For vertical discretization, 57 terrain following levels were selected with the model top being at 10hPa (approx. 35km above sea level).
State of the art global numerical weather prediction models have a horizontal resolution of approximately 0.15°. In comparison this simulation gives a much better representation of the real topography and thus allows for a better representation of the atmospheric circulation systems. E.g. in the global model of ECMWF, the summits of the Alps and the Himalaya have an altitude of 2500m and 6000m which is far away from reality. This can be crucial e.g. for the simulation of convective precipitation during the summer season. Convection permitting simulations are also beneficial for simulating intense cyclones such as hurricanes over the Gulf of Mexico and typhoons in the Pacific Ocean. Due to the usually coarser resolution of the global model, they won’t be able to simulate high intensities as they are observed for e.g. Cat. 4 and 5 storms.
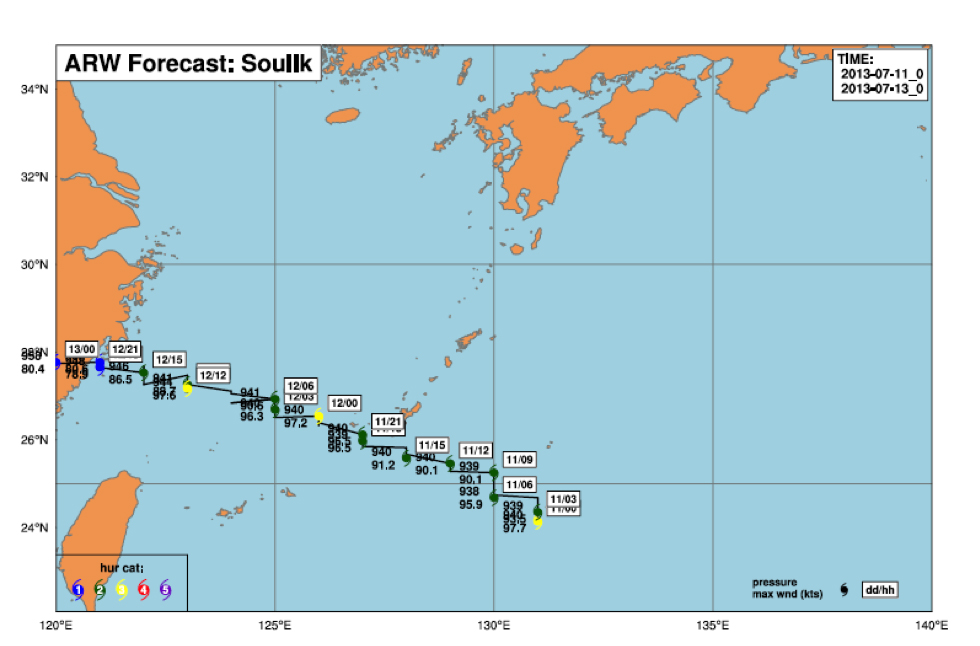
One of the highlights of this study is the simulation of the typhoon Soulik, which developed in the Pacific Ocean in the first 10 days of July 2013. Figure 2 shows the simulated track of the typhoon in 3-hourly intervals from 11 July, 2013 to 13 July, 2013.
It was a category 4 typhoon meaning that average 10m-wind speed exceeds 58m/s. The model was able to simulate the intensity well in accordance with observations, which indicated a central pressure of 925hPa and maximum wind speed of 65m/s.

Figure 2: Predicted track of typhoon Soulik from the WRF simulation during the period July 11, 2013 and July 13, 2013. The colors show the intensity of the typhoon according to the Saffir-Simpson hurricane wind scale.
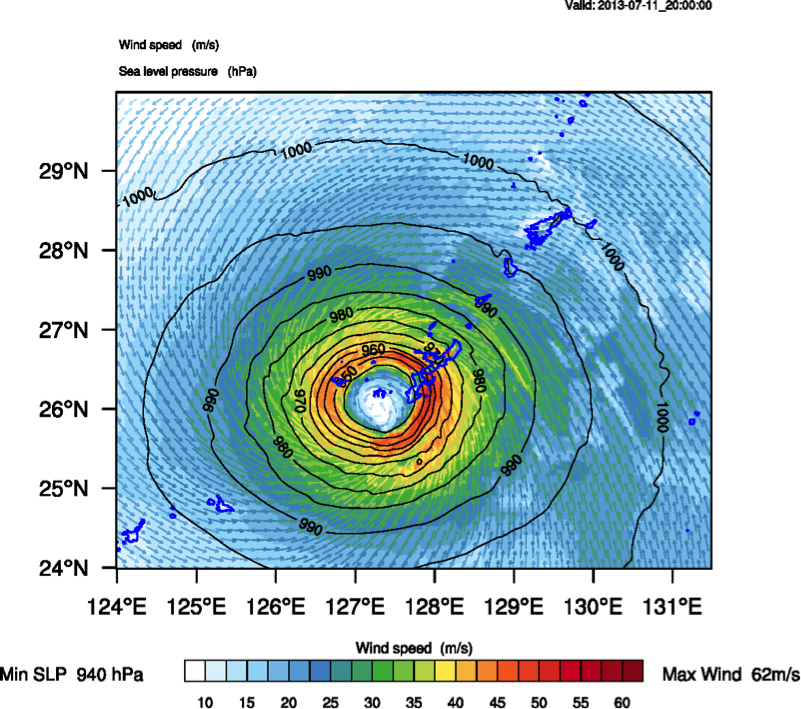
Copyright: University of HohenheimFigure 3 shows an example of the typhoon’s structure with the surface wind speed and sea level pressure during its peak intensity at July 11, 2013. The maximum 10-m wind speed was about 62m/s and the central pressure 940hPa. Also the calm region in the center of the cyclone is clearly visible. The whole simulation experiment was repeated on a 0.12° grid. At this resolution, the track is captured slightly better but the maximum wind speeds are underestimated by about 15m/s compared to the convection permitting resolution simulation with its 0.03° grid.

Figure 3: Sea level pressure [hPa] (black contour lines) and 10m wind speeds [m/s] as shaded areas.
Copyright: University of HohenheimThe comparison with satellite images reveals that the timing of the typhoon’s track in the model was comparable to the observations, although the center of the storm was simulated about 250km further north. The intensity was well captured by the model as shown in Figure 3.
Technical details:
For this simulation, version 3.6.1 of the WRF model was applied. The design of the model source code allows its application in shared-memory (sm), distributed-memory (dm) or hybrid (sm+dm) mode. In order to get the maximum performance, the code was compiled for MPI+OpenMP together with the Cray parallel NetCDF library using PGI 14.7.
After some initial tests, the model was run with 14000 MPI tasks and 6 OpenMP threads per task. In order to investigate certain processes, the output frequency was set to 30min. This results in a total output of approx. 350TB for the two month period including checkpoint files. The simulation’s duration was 84 hours real time and it required 7.05 million Core-h.
From the technical point of view it became evident that it is necessary to pay more attention on the I/O performance since this may become a limiting factor for climate simulations in the future. The I/O rate during the simulation was approx. 7GB/s using 128 OSTs, i.e. the time for writing a single output file is about 13s and deteriorates with the number of MPI tasks.
Research Team and Scientific Contact:
Dr. Thomas Schwitalla, Dr. Kirsten Warrach-Sagi, Prof. Dr. Volker Wulfmeyer (PI)
University of Hohenheim
Institute of Physics and Meteorology
Garbenstrasse 30, D-70599 Stuttgart (Germany)
e-mail: Thomas.Schwitalla@uni-hohenheim.de
www120.uni-hohenheim.de/